
Data and analysis has been something that I have been passionate about since the start of my career.
My background
I have covered many roles in my career, from UX lead to Product owner, Social media manager to Front end developer. I have also been a Data and analytics manager working for a high street retailer. This was a great opportunity and something I 'stumbled' into really. I started in the business as a UX manager, but quickly realised that insight in GA was limited in terms of customer interactivity. I started to add event tracking and building reports and funnels into GA4 (we were still on GA3 at this point). Over time, I had pretty much migrated two brands across to GA4 and managed to gather insight into how customers behaved on site.
What tools did I use?
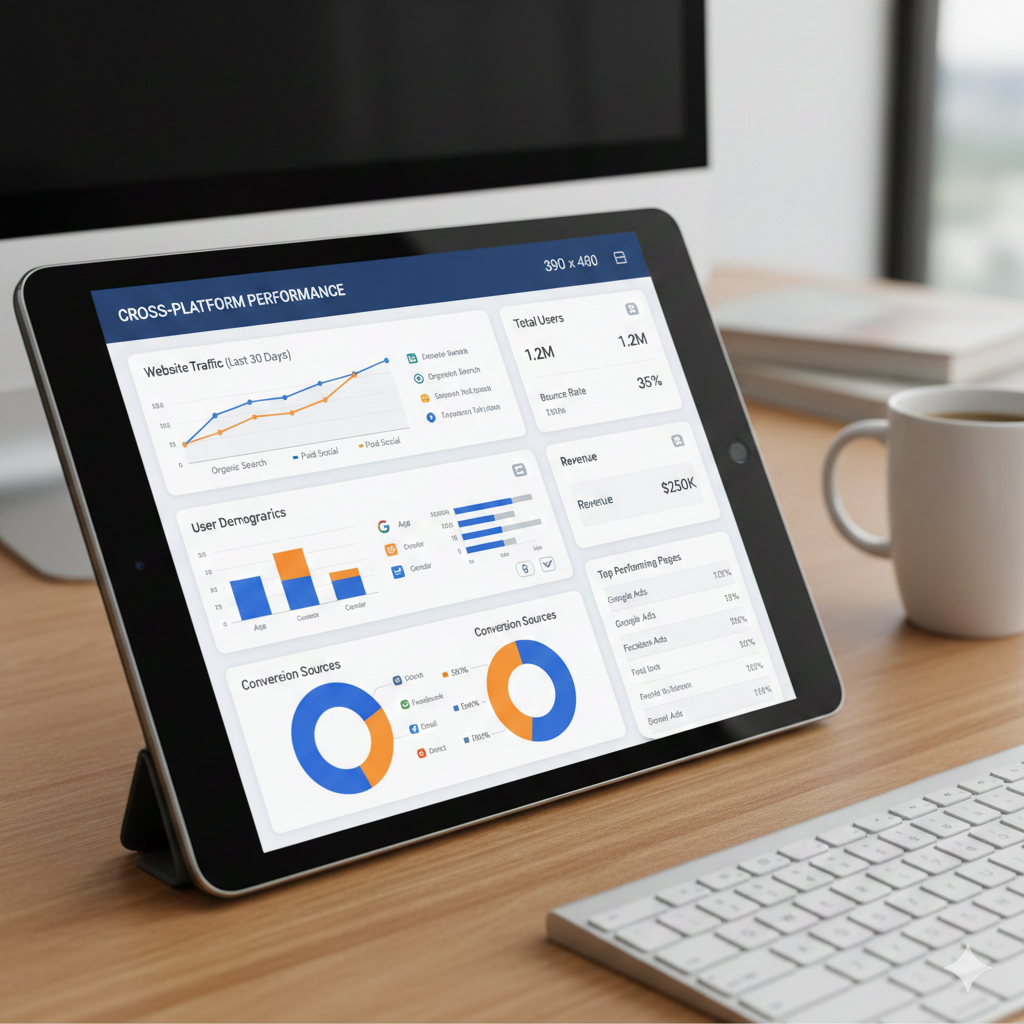
I have been used to using Google tag manager from previous roles and use this for adding event tracking as well as integrating third party tools such as AWIN, Microsoft Clarity and Dotdigital. I decided to go straight into GA4, about 8-9 months before Google decomissioned the older property. I also had to integrate the app into GA4 (most of this work had been done already thankfully). I also wanted to ensure we kept data for a longer period. GA4 keeps data for 14 months maximum, so we needed to build an instance of BigQuery so we can keep the data indefinitely. This would also help once we started reporting on the captured events.
How to display the data
I started to build out a (I admit a rather long) list of exploration reports within GA4. This allows the team to be able to view funnels and events relating to the main shopping funnel, sales performance and interactive elements around site such as search and main navgation. From this, we built a number of Looker studio reports with similar sets of data that can be shared and scheduled via email. We can also leverage BigQuery if we need more detailed data, audiences and blends compared to GA4.
Team training

As part of the migration from GA Universal Analytics to GA4, I was super conscious that our team would be used to looking at data on a daily basis. GA4 was very different compared to UA and missed a lot of what people were used to. GA4 was set to be a data repository where reports could be customised, whereas UA had a lot of pre-made reports with little customisation.
As much as I was comfortable with GA4, in the early days we were still learning so decided to bring in a friend of mine who was a GA expert. He helped to deliver training to the wider team and together, with input from the wider team, we built a comprehensive set of reports in Looker studio, Exploration and the native reports in GA4. This proved to be a massive success and very popular with the team. The sessions were split into modules to make it easier to follow and involved over 20 people in each session.
How do I use this data?
Every time a new piece of functionality is built into the site, or we design a new experience, I ensure the devs update event tracking and the datalayer. This allows me to be able to jump into GTM (dev instance) and build out tracking so we can hit the ground running as the site updates release.
I also continue to update and refine Looker studio reports for the trade team and peak periods throughout the year, allowing those guys to maximise trade opportunities.
Most recently, I have been building a UX dashboard. This dashboard looks at all the insights and events relating to recent changes, any A/B tests we may be running and core metrics such as engagement rate, time spent on site, core funnels and drop out rates.
Feel free to get in touch if you want to discuss any of the above in more detail.